Introduction
As more of our services move to rented virtual servers, applying centralised protective monitoring becomes more of a challenge.
Offerings such as Assuria’s Cloud Security Suite and Splunk’s Storm show the demand for elastic and easily configurable monitoring that can be deployed on cloud provisioned infrastructure.
Amazon has responded to these services by creating their own integrated monitoring solution, CloudWatch.
By running an agent on a provisioned service or host, log data can be collated via Identity and Access Management (IAM) defined users with secret access keys and a specific IAM role.
Depending on the level of monitoring access requested, logged events can range from hardware metrics to custom defined metric filters based on log file contents.
Alarms can then be configured via the AWS dashboard to trigger upon a metric filter being satisfied. For example Amazon gives examples of the following:
- Monitor HTTP response codes in Apache logs
- Receive alarms for errors in kernel logs
- Count exceptions in application logs
Following the definition of an alarm, an email confirming a subscription to the alarm identifier via AWS’ Simple Notification Service is sent.
Setting up the service is straightforward, with RPM packages and automated Python scripts covering the installation process for various server architectures and platforms including Linux and Microsoft Windows.
Monitoring traffic is then sent over a HTTPS connection to API endpoints specific to the monitoring region.
How it might be used
Performance
Performance metrics are likely to be used to dynamically increase resources to meet demands by defining actions to be performed upon an alarm being raised; adding an extra load balanced web server when throughput reaches a certain percentage, for example.
Security
From a security perspective, it allows for integration with existing service output such as Apache’s access.log files, or Auditd’s audit.log.
For example, web servers would benefit from placing triggers on such files to provide a warning if the Apache process attempts to access /etc/passwd. This event could then be cross referenced with the access log and provisioned database logs to determine whether activity was malicious.
Against Shellshock
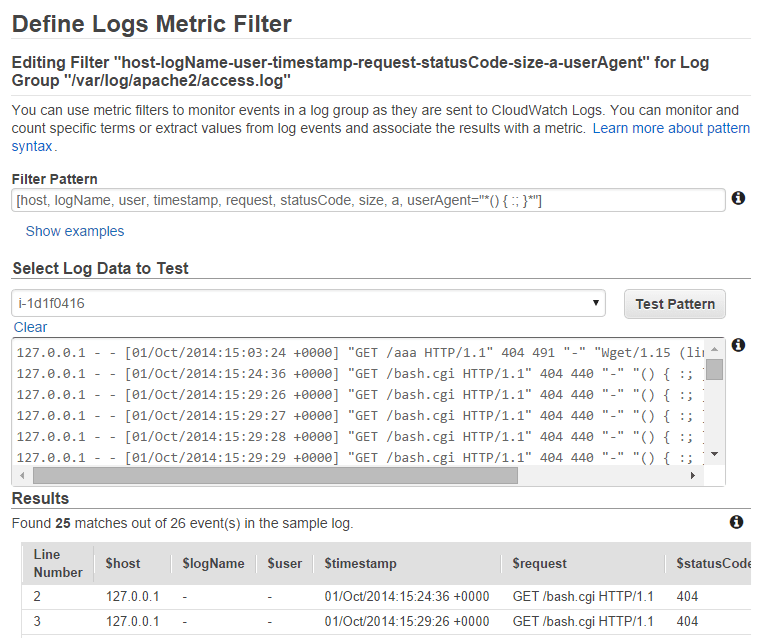
To test the system with a real world example, a filter was set up to log attempts to exploit the recent Shellshock vulnerability using the following simple steps:
Configure the logging agent to record entries to the /var/log/apache2/access.log file:
ubuntu@ip-172-31-41-94:~$ sudo python ./awslogs-agent-setup.py --region us-west-2

Launching interactive setup of CloudWatch Logs agent ...

Step 1 of 5: Installing pip ...DONE

Step 2 of 5: Downloading the latest CloudWatch Logs agent bits ... DONE

Step 3 of 5: Configuring AWS CLI ...

AWS Access Key ID [****************E34Q]:

AWS Secret Access Key [****************JPjL]:

Default region name [us-west-2]:

Default output format [log]:

Step 4 of 5: Configuring the CloudWatch Logs Agent ...

Path of log file to upload [/var/log/syslog]: /var/log/apache2/access.log

Destination Log Group name [/var/log/apache2/access.log]:

Choose Log Stream name:

  1. Use EC2 instance id.

  2. Use hostname.

  3. Custom.

Enter choice [1]:

Choose Log Event timestamp format:

  1. %b %d %H:%M:%S    (Dec 31 23:59:59)

  2. %d/%b/%Y:%H:%M:%S (10/Oct/2000:13:55:36)

  3. %Y-%m-%d %H:%M:%S (2008-09-08 11:52:54)

  4. Custom

Enter choice [1]: 2

Choose initial position of upload:

  1. From start of file.

  2. From end of file.

Enter choice [1]: 1
Define a metric filter to catch the payload of the exploit:


Upon receiving a request with that matched the filter, an alarm was raised and an email sent to the designated address:

Thus we are provided an effective centralized monitoring solution for all of the provisioned services offered by Amazon and the ability to use the existing AWS API means that log storage and processing capabilities can be expanded as you adopt other services or. Like any monitoring software though, the art is in the definition and tuning of the thresholds and alerts to avoid false positives without missing important data.
Further Reading
The following were used by NCC Group when putting this post together:
- Getting Started with CloudWatch
- Install and Configure the CloudWatch Logs Agent on an Existing EC2 Instance
- Monitoring Log Data
- Filtering Log Data
Published date: 02 October 2014
Written by: David Cash
