Managing firewall rulesets in any moderately-sized environment can be a complicated task. As IT infrastructures perpetuate change, firewall rules often become more complicated, overlapped and difficult to manage. We’ve been working on a prototype of a tool which seeks to provide more assurance over firewall rulesets; by providing better insight through visualising the paths through a network where multiple firewalls may be involved. In this blog post we’ll take a look at the techniques that we’re employing and how the solution is shaping up. “A picture speaks a thousand words” – this adage is the crux of the tool dubbed “Visiwall” which graphically presents firewall rulesets in ways which make understanding firewall connectivity much clearer.
In summary the tool parses a firewall configuration and graphically draws the possible paths of connectivity through it. This approach allows individuals reviewing the rules to better understand the context of those rules. This functionality is achieved through the application of the computer science technique of graph theory (more on this in a bit).
The aim of Visiwall is therefore to help:
- Remove complex, overlapping and redundant rules in a firewall.
- Simplify and rationalise firewall rules across an enterprise.
- Spot paths through networks or pivot points that could significantly impact the security of an environment.
Further explanation is best done through use of an example. The image below shows an example Cisco firewall ruleset:
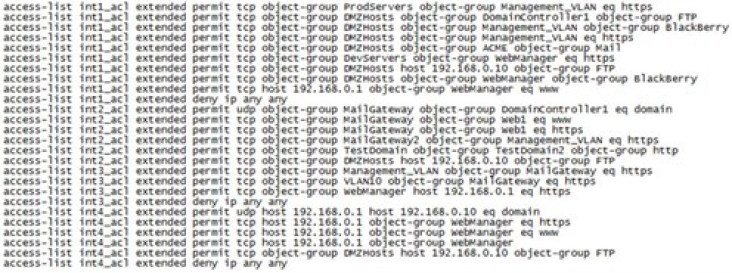
Visiwall converts the ruleset above to the graphical representation below. This is achieved by first identifying entities (network and service objects, hosts etc.) and containing those entities within a firewall object. The firewall object is composed of network interface objects, which in turn are composed of rule objects. This abstraction of a firewall allows for easy representation of the ruleset and querying of the various firewall rule attributes.
Visiwall then iterates over the firewall object and uses the open source framework ‘Graphviz’ to produce a directed graph of the firewall’s allowed connectivity – each source and destination host or network group is plotted as an entity and the allowed service between those entities is plotted as a directed edge on the graph. The resulting image provides a much clearer view of which elements are connected to each other and via which protocols through a firewall:
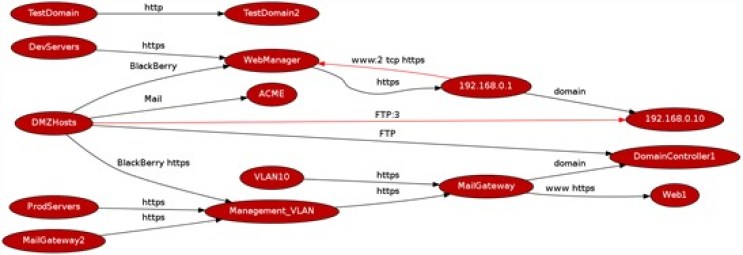
Visiwall also shows overlapping rules – where these are identified the graph edges are coloured red, and the number of times the same rule is seen is appended to the protocol. From a quick perusal of the image above it is therefore possible to quickly identify redundant rules, and also whether any further logical grouping of objects can be achieved within the firewall.
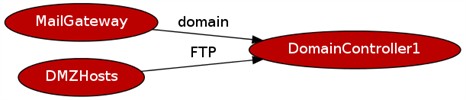
Subgraphs can also be produced on demand – where we may be interested in the allowed connectivity to and from a specific host or entity, we can request this from Visiwall. The example below shows the subgraph of allowed connectivity to and from the ‘DomainController1’ entity:
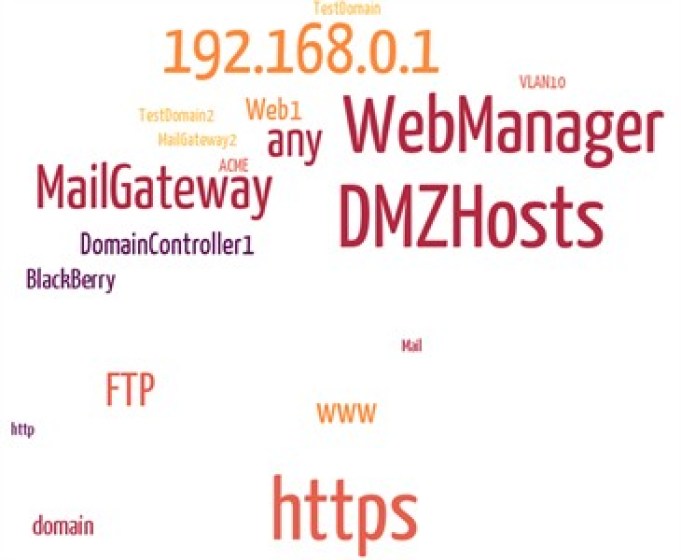
Visiwall also presents a ‘tag cloud’ of the network objects and services in a firewall ruleset. The tag cloud below, drawn from the same ruleset above provides a snapshot of the main hosts and services used within the ruleset. For example, the larger ‘DMZHosts’ object indicates that the object has many incoming and/or outgoing connections (a pivot point), while the larger ‘https’ tag indicates that the https protocol is the main protocol allowed through the firewall:
The examples above are fairly trivial for demonstration purposes; however Visiwall is capable of achieving the same results across rulesets comprising hundreds or even thousands of rules.
Additional functionality in Visiwall includes the ability to query the connected graph to identify whether paths exist between a given source and destination object. Redundant objects can also be identified.
For those interested in how this tool was written, it is written as a web service in Python using the following libraries:
- Bottle – a lightweight micro web-framework for Python – http://bottlepy.org/docs/dev/
- GraphViz – open source graph visualisation software – http://www.graphviz.org/
- PyGraphViz – a Python interface to GraphViz – http://networkx.lanl.gov/pygraphviz/ <
> - NetworkX – a Python package for the creation, manipulation, and study of the structure, dynamics, and functions of complex networks –http://networkx.github.com/
Visiwall is still in its infancy with regards to development but will continue to improve in features. Planned features on the roadmap include:
- Support for more firewall types (different vendors).
- Automatic duplicate rule removal.
- Firewall change control – graphing rules before and after changes for sanity checking.
If you have any feedback on the concept of ‘Visiwall’ and any ideas on additional features we’d love to hear them.
“Visiwall speaks a thousand words… and simplifies those words for an easier read”.
… to pre-empt the inevitable question on when it will be released… we’re discussing if and when we’ll potentially look to open source this tool …
Original Publish date: 04 April 2013
Original Author: Matt Lewis